kiruthika
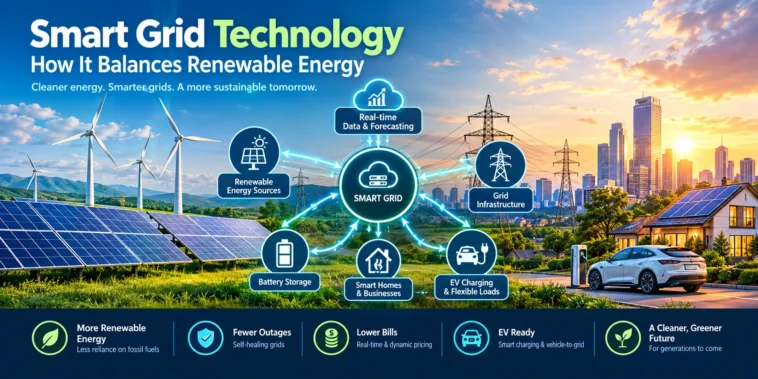
Solar panels don’t care what time your dishwasher runs, and wind turbines don’t slow down just because demand drops at 2 a.m. That mismatch is exactly why smart grid technology exists — it’s the digital nervous system that keeps renewable power stable, predictable, and usable. This guide breaks down how it actually works, in plain English.
Key Highlights
- Global investment in electricity grids reached roughly $400–420 billion in 2024, up from $370–380 billion in 2023, according to the IEA’s World Energy Investment 2025 report.
- The world added a record 295 gigawatts of new solar and wind capacity in 2023, per the IEA — a pace traditional grids weren’t built to handle.
- Global EV sales hit 14 million in 2023, according to the IEA’s Global EV Outlook, adding a huge new variable load that smart grids need to manage.
- The global smart grid market is estimated at roughly $128–149 billion in 2025–2026, with growth forecasts varying by research firm (Meticulous Research, Global Market Insights).
- India announced a $109 billion investment in 2024 to modernize its power grid for renewable integration, per government data cited in industry reports.
- The UK’s National Grid ESO Demand Flexibility Service has nearly 2 million households registered as of 2025, per the UK’s National Energy System Operator (NESO).
- One Demand Flexibility trial saw 200,000 UK households cut electricity use by an average of 59% during a single peak hour, delivering over 108MW of flexibility.
- The world will need to add or replace roughly 80 million km of grid lines by 2040 to keep pace with electrification, according to IEA-based estimates.
What Is Smart Grid Technology?
A traditional power grid is basically a one-way street. Electricity flows from a big power plant to your house, and that’s it — no feedback, no real-time data, no way to know something’s wrong until your lights go out.
A smart grid flips that. It layers sensors, smart meters, and two-way digital communication on top of the physical wires, so the grid can “talk back.” Utilities can see, in near real time, how much power is being generated, where it’s going, and where demand is spiking.
How Smart Grids Actually Work
Three things make this possible:
- Advanced Metering Infrastructure (AMI) — smart meters that report usage every few minutes instead of once a month.
- Sensors and automation — devices that detect faults and reroute power before a small issue becomes a blackout, often called “self-healing” grid capability.
- Demand response systems — software that can signal appliances, EV chargers, or entire factories to shift usage when the grid is under stress.
Put together, this turns a dumb pipe into something closer to the internet — data flows both ways, constantly.
Smart Grid vs Traditional Grid
This is one of the most searched comparisons on this topic, so here’s the difference in plain terms.
| Feature | Traditional Grid | Smart Grid |
| Power flow | One-way (plant to home) | Two-way, real-time data |
| Outage detection | Manual, customer-reported | Automated, self-healing |
| Renewable integration | Limited, unstable | Built to handle variable supply |
| Pricing | Fixed rates | Dynamic, time-of-use pricing |
| Monitoring | Monthly meter reads | Real-time smart meter data |
| EV/battery handling | Not designed for it | Actively manages load and storage |
How Smart Grids Balance Renewable Energy
Here’s the real challenge: solar and wind don’t generate power on a fixed schedule. The sun sets, the wind dies down, and demand doesn’t wait for either.
The Duck Curve Problem
California’s grid operator, CAISO, coined the term “duck curve” to describe this exact issue. Solar output floods the grid at midday, dropping net demand into a deep trough, then demand snaps back sharply in the evening as the sun sets and people get home from work. That steep ramp is one of the hardest things for any grid to manage without smart tools.
Smart grids handle it by combining forecasting, storage, and flexible demand — shifting load into the sunny hours and pulling in backup capacity fast during the evening ramp, rather than relying on slow-to-start fossil fuel plants.
Demand Response and Flexibility Programs
The UK’s National Grid ESO runs a Demand Flexibility Service that pays households and businesses to shift electricity use away from peak hours. In one widely reported trial, participating households cut their electricity use by an average of 59% during a single test hour, providing over 108MW of flexibility to the grid. Octopus Energy’s “Saving Sessions,” built on the same concept, has attracted over 400,000 signed-up households.
Battery Storage and EV Integration
Electric vehicles are both a challenge and a tool. Left unmanaged, millions of EVs charging at the same time could overload local grids. But smart charging software can schedule that charging for off-peak, renewable-rich hours — and some pilot programs are testing the reverse: using parked EV batteries to send power back to the grid when it’s needed most.
Smart Grid Technology Examples
Real deployments already show how this plays out:
- California (CAISO): Uses flexible resources, time-of-use rates, and regional energy sharing to manage the duck curve as solar penetration grows.
- United Kingdom (National Grid ESO/NESO): Runs the Demand Flexibility Service, with nearly 2 million households registered and a new £4 million ($5.4 million) government-backed challenge to shift 2GW of peak demand by 2030.
- Germany (E-Energy program): A €140 million pilot program (2009–2012) tested smart grid technology across six regions, including wind power integration and EV charging, with participation from Siemens, SAP, and ABB.
- India: Announced a $109 billion investment in 2024 to modernize grid infrastructure specifically to accommodate renewable energy growth.
- United States (DOE Grid Deployment Office): Committed around $2 billion in 2024 across roughly 38 grid modernization projects.
Important Statistics Table
| Metric | Figure | Source |
| Global grid investment (2024) | ~$400–420 billion | IEA World Energy Investment 2025 |
| New solar + wind capacity added (2023) | 295 GW | IEA |
| Global EV sales (2023) | 14 million | IEA Global EV Outlook 2024 |
| Global smart grid market (2025) | ~$128–149 billion (varies by source) | Meticulous Research / GMI |
| India grid modernization investment (2024) | $109 billion | Indian government / industry reports |
| US DOE grid project funding (2024) | ~$2 billion across 38 projects | US Department of Energy |
| UK Demand Flexibility Service participants | ~2 million households | National Energy System Operator (NESO) |
| Grid lines needing addition/replacement by 2040 | ~80 million km | IEA-based estimate |
Benefits and Challenges of Smart Grid Technology
| Benefits | Challenges |
| Fewer and shorter outages via self-healing tech | High upfront infrastructure cost |
| Better renewable energy integration | Cybersecurity risks from connected devices |
| Real-time usage data lowers consumer bills | Privacy concerns over granular usage data |
| Supports EV charging without overloading grids | Grid workforce needs new digital skills |
| Enables dynamic, fairer pricing | Rural areas often upgraded last |
2026 Trends and What’s Next
The clearest trend heading into 2026 is AI-driven forecasting. The UK’s 2GW Peak Time Flexibility Challenge is specifically funding AI systems that predict energy use days in advance using smart meter and weather data, aiming to shift demand equivalent to 1.5 million homes’ worth of electricity by 2030.
Investment is also accelerating unevenly by region — Asia Pacific is projected to cross $81 billion in smart grid spending by 2035, driven largely by China’s advanced metering rollout and India’s grid modernization push. Meanwhile, virtual power plants — networks of home batteries and solar systems acting as one coordinated resource — are moving from pilot projects to standard grid tools in markets like Australia and California.
References
- IEA — World Energy Investment 2025 Report
- IEA — Global EV Outlook 2024
- Meticulous Research — Smart Grid Market Size & Share Report (2026–2036)
- Global Market Insights — Smart Grid Market Size & Share 2026–2035
- National Energy System Operator (NESO), UK — Demand Flexibility Service
- Current News UK — National Grid ESO Demand Flexibility Test Reports
- Enlit World — UK 2GW Peak Time Flexibility Challenge
- CAISO — Flexible Resources Help Renewables Fast Facts
- IRENA — Demand-Side Flexibility for Power Sector Transformation (2019)
- Telenor IoT — Smart Grid IoT Balances Supply with Demand
- AllPCB — Applications of Smart Grids (Germany E-Energy program)
- UC Riverside Engineering Online — The Future of Smart Grid Technologies
Conclusion
Smart grid technology is what makes it possible to run a power system on sunshine and wind instead of just coal and gas — by watching, predicting, and adjusting in real time. As grid investment climbs past $400 billion a year and EV adoption keeps rising, this digital layer isn’t optional anymore; it’s the backbone of a renewable-powered grid.
FAQs
It’s a power grid upgraded with sensors, smart meters, and two-way communication, so utilities can monitor and manage electricity flow in real time instead of waiting for outage reports.
It uses real-time data, demand response programs, and battery storage to match supply with demand even when solar and wind output changes quickly, smoothing out patterns like California’s duck curve.
A traditional grid sends power one way with no feedback. A smart grid is two-way — it collects live data, detects faults automatically, and supports dynamic pricing and renewable integration.
California’s CAISO duck curve management, the UK’s National Grid Demand Flexibility Service, Germany’s E-Energy pilot program, and India’s $109 billion grid modernization plan are all active examples.
High upfront infrastructure costs, cybersecurity risks from thousands of connected devices, consumer privacy concerns, and a shortage of digitally skilled grid workers.